
Net Working Capital: How to Explain It in an Interview

Net working capital shows up in nearly every IB first round I hear about, and the formula is where most students stop. The interviewer isn't checking whether you know the formula. They're checking whether you understand what the number does to cash. I'm Stephen Turban. I went to Harvard, went through McKinsey's on-cycle recruiting, and now run WallStreetGuide, where I prep undergrads for banking and consulting interviews.
So this guide walks through the whole mechanism in plain words: the banker definition and why it drops cash and debt, what each line item means, how a change in net working capital moves through the three statements with numbers, where it lands in a DCF and an LBO, how buyers and sellers fight over it in M&A, the cash conversion cycle, negative working capital businesses, how to project it in a model, and the classic interview questions answered in full. Every number is worked, so you can rebuild any of it on a whiteboard.
What is net working capital in an interview answer?
In an interview, net working capital means operating current assets minus operating current liabilities: receivables, inventory and prepaid expenses on one side, payables, accrued expenses and deferred revenue on the other, with cash and debt left out. If net working capital increases, cash goes down. If it decreases, cash goes up. This is because the company is either tying up more cash in its operations or freeing up cash. That’s why changes in net working capital are included when calculating free cash flow.
Why do banks exclude cash and debt from net working capital?
Cash and debt are excluded because they relate to how a company manages its money, not how it runs its business. Bankers strip cash and debt out so net working capital measures only the money tied up in running the business day to day. Cash and debt are looked at separately when analyzing a company's overall value.
1. The textbook definition and the banker definition give two different numbers, and interviews want the second one
The textbook version is a liquidity test. Current assets minus current liabilities tells you whether a company could pay everything it owes in the next twelve months using everything it could turn into cash in the next twelve months. Accountants and credit analysts care about it. Bankers mostly don't, because it mixes operating items with financing items.
Here's a fictional company I'll use all the way through: Ridgeline Outdoor Co., a maker of tents and camping gear with about $1 billion of revenue. Its year-end balance sheet, in millions:
Current assets | $ | Current liabilities | $ |
Cash | 50 | Accounts payable | 70 |
Accounts receivable | 80 | Accrued expenses | 30 |
Inventory | 120 | Deferred revenue | 20 |
Prepaid expenses | 10 | Short-term debt | 40 |
Total current assets | 260 | Total current liabilities | 160 |
Textbook working capital: 260 minus 160, so $100 million.
Now the banker version. Take cash out of the asset side and short-term debt out of the liability side, and you're left with operating current assets of 210 (80 + 120 + 10) and operating current liabilities of 120 (70 + 30 + 20). Net working capital: $90 million.
Same company, two numbers, ten million apart. The banker definition of net working capital is operating current assets minus operating current liabilities, and the word "operating" is doing all the work.
Ridgeline borrows $50 million with a five-year loan and parks it in the bank. Cash rises to 100, long-term debt (not a current liability) rises by 50. Textbook working capital jumps from 100 to 150. Borrowing cash and parking it in the bank moves textbook working capital and leaves the banker's net working capital exactly where it was, because cash and debt were never in it. Nothing about tents, customers or suppliers changed, and the banker's number says so.
You'll hear the same idea under several names: operating working capital, non-cash working capital, or just "working capital" when a banker says it. In a model they all mean the version without cash and debt. A few firms also pull out other items that behave like financing (short-term investments, the current slice of long-term debt, sometimes income taxes payable). In an interview, name cash and debt and move on. If the interviewer wants the finer cuts, they'll ask.
One aside on where the phrase comes from. Finance textbooks (Brigham and Houston's Fundamentals of Financial Management tells this version) trace "working capital" to the old Yankee peddler who loaded a wagon with goods and drove a route selling them. The goods were his working capital, because they were what he turned over to make a profit. The horse and wagon were his fixed assets. The loan he took to buy the goods, and paid off after each trip, was a working capital loan. A couple of centuries later, the receivables and inventory on Ridgeline's balance sheet are the same wagon of goods.
2. Every operating item is a timing gap between the income statement and cash
The income statement records revenue when a sale happens and costs when they're incurred, not when money moves. Net working capital is the collection of places where that timing runs ahead of or behind the cash. Once you see each line that way, the sign logic in the next section stops being something to memorize.
The assets are places where Ridgeline has spent cash or earned revenue but is still waiting on the money:
Accounts receivable. Ridgeline ships $80 million of tents to retailers on 30-day terms. The sales are in revenue today. The cash arrives next month. Until then, Ridgeline is lending its customers $80 million at zero interest.
Inventory. Ridgeline buys fabric and poles and builds tents it hasn't sold yet. The cash left when it paid for materials and labor, but the expense (cost of goods sold) only hits the income statement when a tent sells. In the meantime $120 million sits in a warehouse.
Prepaid expenses. Ridgeline pays a year of insurance in January. Cash went out in January. The expense shows up one twelfth at a time over the year. The unexpensed part is an asset because the company has paid for something it hasn't used yet.
The liabilities are places where someone else is waiting on Ridgeline's money, so Ridgeline gets to hold the cash a little longer:
Accounts payable. Suppliers delivered fabric and sent invoices due in 45 days. The inventory is on Ridgeline's balance sheet. The $70 million hasn't left its bank account. Suppliers are lending Ridgeline money at zero interest.
Accrued expenses. Costs Ridgeline has incurred but hasn't been billed for or paid: two weeks of wages before payday, a utility bill for last month, a bonus that's been earned but will be paid in March. The expense is already on the income statement. The cash is still in the company.
Deferred revenue. A customer pays Ridgeline $20 million in advance for a season of branded gear it will deliver next quarter. The cash is in. The revenue can't be recorded until the gear ships, so the balance sheet records a liability: Ridgeline owes the customer tents.
Operating current assets are money the company has tied up in running its business, like inventory it hasn’t sold yet or sales customers haven’t paid for. Operating current liabilities are bills the company hasn’t paid yet, like money owed to suppliers.Net working capital is the difference, so a positive $90 million means Ridgeline has to finance $90 million of its own operations out of its own pocket (or with bank debt) at any given moment.
This also explains why growing a business can use up cash. If Ridgeline sells twice as many tents, it may need to buy more materials and make more tents before customers pay for them. Even though it will eventually earn more money, it needs cash upfront to support that growth.Some of it is offset by twice the payables, but for most manufacturers and distributors the assets outrun the liabilities. The key takeaway: growing a business often requires spending cash before the company receives cash from sales.
3. An increase in net working capital uses cash, and here's the full walk with numbers
The rule you'll hear is "an increase in NWC is a use of cash, a decrease is a source of cash." True, but it's a conclusion. Here's the mechanism.
Ridgeline has a good year. Revenue grows from $1.00 billion to $1.05 billion. Here's how the operating items moved:
Item ($ millions) | Year 1 | Year 2 | Change | Cash effect |
Accounts receivable | 80 | 95 | +15 | (15) |
Inventory | 120 | 130 | +10 | (10) |
Prepaid expenses | 10 | 10 | 0 | 0 |
Accounts payable | 70 | 75 | +5 | +5 |
Accrued expenses | 30 | 30 | 0 | 0 |
Deferred revenue | 20 | 20 | 0 | 0 |
Net working capital | 90 | 110 | +20 | (20) |

The same table in a sheet: receivables and inventory up 25, payables up 5, and the 20 of net working capital build shows up as 20 of cash out.
Parentheses mean cash going out. Read the lines one at a time.
Receivables rose by $15 million. Ridgeline recorded $15 million more in sales than it collected. The income statement counted that money as revenue. The bank account never saw it. So relative to net income, cash is $15 million lower.
Inventory rose by $10 million. Ridgeline paid for $10 million of tents that haven't sold. Nothing hit the income statement, because cost of goods sold only records inventory when it's sold. Cash went out anyway. Relative to net income, cash is another $10 million lower.
Payables rose by $5 million. Ridgeline received $5 million more in fabric than it paid for. The inventory is counted. The cash hasn't left. Relative to net income, cash is $5 million higher.
Add it up: 15 and 10 out, 5 in, and Ridgeline has $20 million less cash than its net income suggests. Net working capital went from 90 to 110, an increase of 20, and the cash flow statement shows a $20 million outflow. Those are the same fact described twice.
When an operating asset goes up or an operating liability goes down, the company has less cash than its earnings imply, and the change in net working capital is the line that corrects for it. The reverse holds too. If receivables fall because customers paid faster, cash is higher than net income suggests, and the change in NWC shows an inflow.
There are two common mistakes to avoid.
1. Getting the sign backward. If net working capital increases by $20 million, that means the company used $20 million of cash. If it decreases by $20 million, the company freed up $20 million of cash. Different formulas may show the signs differently, but the meaning is the same.
2. Saying working capital changes affect the income statement. They don't directly affect it. The income statement records revenue and expenses, but it doesn't always show when cash actually comes in or goes out.
For example, a company can record a sale today even if the customer won't pay for another month. Net working capital helps account for that timing difference and shows how much cash the business actually has available.
The 50 accounting questions article drills this reconciliation from several angles.
4. The change in net working capital is the line that turns net income into cash from operations
Open any 10-K and go to the cash flow statement. The operating section starts with net income, adds back expenses that never used cash (depreciation and amortization, stock-based compensation), and then lists a block called "changes in operating assets and liabilities." That block is the change in net working capital, shown item by item. Amazon's, for example, lists inventories, accounts receivable, accounts payable, accrued expenses and unearned revenue on separate lines.
Here's Ridgeline's Year 2, built from the table above. The income statement: EBIT of $100 million, interest expense of $20 million, pre-tax income of $80 million, taxes at 25 percent of $20 million, net income of $60 million. Depreciation and amortization of $20 million was inside EBIT.
Cash flow from operations, Year 2 ($ millions) | |
Net income | 60 |
Plus: depreciation and amortization | 20 |
Less: increase in net working capital | (20) |
Cash flow from operations | 60 |
The 20 of D&A comes back because it reduced earnings without any cash leaving. The 20 of NWC build comes out because cash left (into receivables and inventory) without reducing earnings. They happen to offset here, and that's not unusual for a mature company. For a fast-growing company, the net working capital line is often bigger than D&A, and cash from operations runs well below net income.
Net income records what the company earned, cash from operations records what actually landed in the bank, and the change in net working capital is most of the gap between them. When an interviewer asks why a profitable company can run out of cash, this is the line to point at.
5. In a DCF, the increase in net working capital comes straight out of unlevered free cash flow
A DCF values a business on the cash it produces for everyone who funded it (lenders and shareholders together), before any interest. That cash is unlevered free cash flow, and the standard build is:
Unlevered free cash flow = EBIT × (1 minus tax rate) + D&A minus capital expenditures minus the increase in net working capital.
Each piece has a reason. EBIT times one minus the tax rate is the after-tax operating profit as if the company had no debt. D&A comes back because it isn't cash. Capex comes out because buying machines and buildings is cash the income statement spreads over years. And the increase in NWC comes out for the reason section 3 walked: growth ties up cash in receivables and inventory that the income statement never charged for.
Ridgeline's Year 2:
Unlevered free cash flow, Year 2 ($ millions) | |
EBIT | 100 |
Less: taxes at 25 percent | (25) |
Net operating profit after tax | 75 |
Plus: D&A | 20 |
Less: capital expenditures | (25) |
Less: increase in net working capital | (20) |
Unlevered free cash flow | 50 |
Now change one thing. If net working capital had stayed flat, free cash flow would be 70. If Ridgeline had squeezed $20 million out of working capital (collected faster, carried less inventory), it would be 90. A $20 million build in net working capital took almost a third of Ridgeline's free cash flow that year, and the valuation falls with it. Multiply that across a five-year projection and a terminal value and you can see why interviewers want you to have the sign right.

Free cash flow would have been 70 with working capital flat; the 20 that went into receivables and inventory is the orange bar.
Three points that separate a good answer from a memorized one:
Only the change goes in, never the balance. Ridgeline's $110 million of NWC doesn't appear anywhere in the DCF. The $20 million increase does. Students who subtract the whole balance are subtracting money the company already spent years ago.
The drag scales with growth. If NWC runs at about 10 percent of revenue (Ridgeline's 110 on 1,050 is close), every $100 million of new revenue needs roughly $10 million of cash up front. Faster growth, bigger drag. A DCF that projects 20 percent revenue growth with no NWC build is overstating cash.
Account for working capital in the terminal year, too. A DCF assumes the company continues growing beyond the forecast period. If revenue keeps growing, the company will likely need more working capital to support that growth. You should account for this in the terminal year rather than assuming the need for additional working capital disappears. Otherwise, you'll overestimate the company's value.
Our walk-me-through-a-DCF article has the full seven-step answer. Net working capital is step three in that walk, and it's the step most students mumble through.
6. In an LBO, every dollar of net working capital build is a dollar that doesn't pay down debt
A private equity firm buys Ridgeline with mostly borrowed money and plans to pay the debt down from the company's own cash flow over five years. The return depends on how much debt gets repaid. So the number the sponsor watches is cash available for debt repayment:
Cash available for debt repayment = EBITDA minus cash interest minus cash taxes minus capital expenditures minus the increase in net working capital.
Say post-deal Ridgeline has EBITDA of $100 million, pays $35 million of cash interest on its new debt, $15 million of cash taxes, and $20 million of capex.
Scenario | EBITDA | Interest | Taxes | Capex | NWC change | Cash for debt paydown |
NWC up 20 | 100 | (35) | (15) | (20) | (20) | 10 |
NWC flat | 100 | (35) | (15) | (20) | 0 | 30 |
NWC down 20 | 100 | (35) | (15) | (20) | +20 | 50 |
Same EBITDA, same interest, and the amount of debt the company can repay ranges from $10 million to $50 million depending on one line. In an LBO, a net working capital build is debt that doesn't get repaid this year, and debt that isn't repaid keeps costing interest next year. Over five years at $20 million a year, that's $100 million of debt still outstanding at exit that the sponsor's base case assumed would be gone, plus the interest on it along the way.
Sponsors love businesses that need little working capital or run it negative, because every dollar not tied up in receivables and inventory goes to the lenders instead. Software companies that bill annually in advance, restaurant chains where customers pay at the counter, and distributors with real supplier terms all throw off more cash per dollar of EBITDA than a manufacturer with 60 days of receivables and 90 days of inventory. It's also why a PE interviewer, after you've walked an LBO, might ask, "What would make you worry about this company's working capital?" They want to hear "receivables growing faster than revenue" (section 11), not a blank look.
The EBITDA in that table is an accrual number, by the way, and it never captures any of this. Our EBITDA explainer covers why, and the six-step LBO walk-through shows where this line sits in the full model.
7. The working capital peg is where M&A deals fight over net working capital
Here's the part of net working capital that almost no undergrad has heard of, and that a deal-team interviewer will light up about if you have.
When a company is sold, the price is usually set on a cash-free, debt-free basis. This means the seller keeps the company's cash and pays off its debt, while the buyer purchases the actual business.
However, the buyer also expects the business to have a normal amount of working capital, such as inventory to sell and money owed by customers.
Imagine the seller collects all outstanding customer payments, delays paying suppliers, and sells off most of its inventory right before the sale. The seller would keep more cash, but the buyer would inherit a business without enough resources to operate normally.
That's why the buyer and seller agree on a normal level of working capital that must be left in the business at closing. If the actual amount is too low, the purchase price is usually reduced to compensate the buyer.
So the two sides agree on a working capital peg. The working capital peg is the normal level of net working capital the buyer and seller agree the business needs to run, usually a trailing twelve-month average, and the purchase price moves dollar for dollar against it at closing. The average smooths out seasonality. At closing, the seller delivers an estimate of actual NWC. The price adjusts dollar for dollar against the peg. Then, 60 to 120 days later, the buyer prepares a final closing statement with real numbers, the two sides true up the difference, and anything they can't agree on goes to an independent accountant.
With numbers. Ridgeline sells for $500 million with a $50 million peg.
Closing net working capital | Versus peg | Final price |
45 | (5) | 495 |
50 | 0 | 500 |
58 | +8 | 508 |
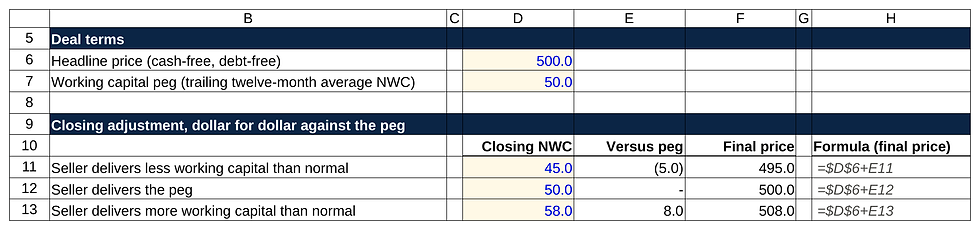
Every dollar of closing working capital above or below the 50 peg, moves the 500 price by a dollar, and the formula is one addition.
Deliver $5 million less working capital than normal and you're paid $5 million less, because the buyer has to put that $5 million in to run the company. Deliver $8 million more and you're paid $8 million more, because you're handing over cash tied up in receivables that the buyer will collect. Many agreements add a collar: no adjustment unless the gap exceeds, say, $2 million, so a $1 million miss changes nothing but a $4 million miss adjusts the full $4 million.
Buyers argue for a high peg and sellers argue for a low one, because every dollar of peg is a dollar of purchase price moving between them. The seller's banker will point to the low-season months in the twelve-month average. The buyer's banker will point to the growth in receivables that comes with the growth they're paying for. The definitions matter too: whether a disputed receivable counts, how inventory is valued, whether accrued bonuses are in or out. Deal lawyers spend real hours on the schedule that lists exactly which balance sheet lines are inside the peg.
How much can go wrong? In 2015, Chicago Bridge & Iron sold its nuclear construction subsidiary, Stone & Webster, to Westinghouse for a purchase price of zero dollars, with a working capital target of $1.174 billion. Chicago Bridge estimated closing net working capital at about $1.6 billion and said Westinghouse owed it roughly $428 million. Westinghouse came back with a closing calculation of negative $976.5 million, more than $2 billion below the target, which would have meant Chicago Bridge paying Westinghouse the difference. The two numbers were more than $2.5 billion apart on a deal priced at zero. The Delaware Supreme Court ended the fight in June 2017, ruling that the working capital true-up was a narrow mechanism for measuring changes between signing and closing using the seller's historical accounting, and that Westinghouse couldn't use it to relitigate how the whole business had been accounted for. M&A lawyers still cite it. Mention it in a deal discussion and the interviewer will know you've done the reading.
If you're prepping deal questions, our 10 deal discussion questions article covers how to talk about a transaction end to end. The peg is the detail that makes a purchase price discussion sound like you've seen a purchase agreement.
8. The cash conversion cycle turns net working capital into days you can compare across companies
Dollar amounts of NWC don't compare well. $110 million is a lot for Ridgeline and a rounding error for Walmart. Bankers convert each item into days, and the three ratios are worth knowing cold.
Days sales outstanding (DSO) is how long, on average, customers take to pay. Accounts receivable divided by revenue, times 365. Ridgeline: 80 ÷ 1,000 × 365, about 29 days.
Days inventory outstanding (DIO) is how long a unit sits before it's sold. Inventory divided by cost of goods sold, times 365. You use COGS rather than revenue because inventory is carried at cost. Ridgeline, with COGS of $600 million: 120 ÷ 600 × 365, about 73 days.
Days payable outstanding (DPO) is how long the company takes to pay its suppliers. Accounts payable divided by COGS, times 365. Ridgeline: 70 ÷ 600 × 365, about 43 days.
Then the cash conversion cycle (CCC) puts them together: DSO plus DIO minus DPO. Ridgeline: 29 + 73 minus 43, about 60 days. Here's what that means in plain words. Fabric arrives and Ridgeline has 43 days before it has to pay for it. The fabric becomes a tent that sits for 73 days before it sells. The retailer then takes 29 days to pay. From the day Ridgeline pays its supplier to the day it collects from its customer is 73 + 29 minus 43, about 60 days. For 60 days, every tent is financed by Ridgeline. The cash conversion cycle is the number of days a company has to fund its own operations between paying suppliers and getting paid, and the longer it runs, the more cash growth eats.
Now a real one. Amazon, from its fiscal 2020 10-K:
Amazon, fiscal 2020 ($ millions) | |
Net sales | 386,064 |
Cost of sales | 233,307 |
Accounts receivable, net and other | 24,542 |
Inventories | 23,795 |
Accounts payable | 72,539 |
DSO (24,542 ÷ 386,064 × 365) | 23.2 days |
DIO (23,795 ÷ 233,307 × 365) | 37.2 days |
DPO (72,539 ÷ 233,307 × 365) | 113.5 days |
Cash conversion cycle | negative 53.1 days |
Amazon is a good example of why negative net working capital can actually be a strength.
Amazon often collects money from customers before it has to pay its suppliers. This means it can use that cash to run its business without needing as much of its own money or borrowing from a bank.
For example, if Amazon collects payment today but doesn't have to pay its supplier for another three months, it can use that cash in the meantime.
Amazon collected from customers about 23 days after a sale on average (most pay instantly; the receivables line also carries vendor and other receivables), turned inventory in about 37 days, and paid suppliers after about 114 days. Add it up and Amazon had its customers' money about 53 days before it had to pay for the goods. Amazon says as much in the overview of the filing's management discussion: "our high inventory velocity means we generally collect from consumers before our payments to suppliers come due." In 2025, Amazon's estimated cash conversion cycle was around negative 51 days using reported accounts receivable, inventory, and accounts payable figures. This is a rough estimate because reported receivables also include amounts owed by vendors and other parties, not just customers.

Read each panel left to right from the day the supplier delivers: Ridgeline pays on day 43 and collects on day 102, while Amazon collects on day 60 and pays on day 114.
Think about what a negative cycle does during growth. Amazon collects from customers roughly 50 days before it pays its suppliers, so every dollar of growth produces cash instead of consuming it, the opposite of Ridgeline. Every time Amazon sells more, it collects the extra cash weeks before paying for the extra inventory. The 2020 operating working capital was about negative $24 billion (receivables plus inventory minus payables). That's $24 billion of other people's money funding the business, interest-free.
Two cautions when you use these ratios in an interview. Use the same denominator convention each time (some analysts use revenue for DPO; COGS is more common), and compare companies within an industry. A grocer's 10-day DIO and an aircraft maker's 200-day DIO are both normal.
9. Negative working capital can be a strength or a warning, and the interviewer wants to know you can tell which
Negative net working capital means the company owes more money in the short term than it has tied up in things like inventory and unpaid customer bills.
This isn't always a bad thing. It depends on the business.
For example, a retailer might collect cash from customers immediately but pay its suppliers weeks later. This means it has cash coming in before it needs to pay its bills, which can actually be a strength.
The key takeaway: negative net working capital isn't automatically bad. It depends on whether the company is managing its cash efficiently or struggling to pay its bills.
Three business models produce it on purpose:
Customers pay first. Subscription software firms bill a year upfront and sit on deferred revenue. Restaurant chains get paid at the register and pay food suppliers weeks later. Airlines sell tickets weeks before the flight. The customer is the lender.
Suppliers get paid late, by agreement. Amazon, Walmart and other giant retailers negotiate long terms because suppliers want the volume. The supplier is the lender.
Inventory barely exists. Build-to-order models carry days of inventory instead of months.
Dell in the 1990s is the classic case of the third type, and it's worth knowing because interviewers who came up through the 2000s still cite it. Dell sold PCs directly, built each one after the customer ordered and paid, and only then bought components. A Berkeley study of Dell's production network tracked inventory falling from about 32 days of supply in 1994 to 13 days in 1997 and 8 days in 1998, and spelled out the result: Dell "took possession of the customer's money before paying its suppliers, thereby funding its own operating expenses." Reporting from 1998 put Dell's cash conversion cycle in negative territory, with contemporary accounts describing roughly five days of inventory, about 30 days of receivables and payables near 59 days, which works out to about negative 24 days. Compaq and HP, selling through retailers, carried weeks of finished goods. Dell's growth funded itself while its rivals' growth consumed cash.
Negative working capital is a strength when it comes from customers paying early, suppliers agreeing to long terms, or inventory that turns in days, because growth then generates cash instead of consuming it.
Now the other kind. A struggling retailer can also show negative working capital: payables are high because it can't pay suppliers, inventory is low because suppliers have stopped shipping, receivables are low because sales are falling. The sign is the same, and the story is the opposite. Negative working capital is a warning when payables are rising because the company can't pay them, and the tell is a cash balance that's shrinking while payables days climb.
How to tell them apart in an interview or a model:
Look at the trend in DPO. Amazon's rising DPO comes with record cash. A distressed company's rising DPO comes with a falling cash balance and, often, a drawn revolver.
Read the notes. Suppliers tightening terms, factoring receivables, a going-concern paragraph from the auditor.
Ask what happens when sales fall. A healthy negative-NWC business sees its float shrink gradually. A distressed one hits a wall when suppliers demand cash on delivery.
That last point is the subtle one. Negative working capital is a loan from your customers and suppliers, and loans have to be repaid. When a subscription business's bookings slow, deferred revenue stops growing and the cash it was spending ahead of delivery dries up. When a retailer's sales drop, payables still come due on the inventory it already bought. A negative-NWC business runs in reverse during a downturn, so the same model that generated cash on the way up consumes it on the way down. Mention that unprompted and you've shown the interviewer you understand the mechanism, not the label.
10. How to project net working capital in a model: days-based beats percent of revenue when terms are changing
Every three-statement model, DCF and LBO needs future NWC, and there are two ways to build it.
The percent-of-revenue method. Take each item as a percent of revenue (or COGS for inventory and payables) in the last historical year and hold the percentage. Ridgeline's receivables were 95 on revenue of 1,050 in Year 2, about 9 percent. Project Year 3 revenue at 1,100 and receivables land at 99.5. Fast, fine for a two-hour modeling test, and standard for the smaller items (prepaids, accrued expenses, deferred revenue).
The days method. Compute historical DSO, DIO and DPO, decide where each is heading, and rebuild the balance from the days. Receivables = DSO ÷ 365 × revenue. Inventory = DIO ÷ 365 × COGS. Payables = DPO ÷ 365 × COGS. Mathematically it's the same as a percentage. Days are the language management, lenders and buyers speak, so a working capital assumption stated in days can be checked against reality in a way a percentage can't. You can sanity check "we're assuming collections slow from 33 to 40 days" with one phone call to the credit team. Nobody can do that with "9.0 percent versus 10.9 percent."
Here's Ridgeline's Year 2 actuals (revenue of 1,050, COGS of 630) converted to whole days, then projected to Year 3 with those rounded days held flat on revenue of 1,100 and COGS of 660. Rounding to whole days is what you'd do in a test; the exact days (33.0, 75.3 and 43.5) give a Year 3 figure about $1.5 million higher. The smaller items are held at their Year 2 percent of revenue.
Item ($ millions) | Year 2 actual | Days or % | Year 3 projected |
Accounts receivable | 95 | 33 days (DSO) | 99.5 |
Inventory | 130 | 75 days (DIO) | 135.6 |
Prepaid expenses | 10 | 1.0% of revenue | 10.5 |
Accounts payable | 75 | 44 days (DPO) | 79.6 |
Accrued expenses | 30 | 2.9% of revenue | 31.4 |
Deferred revenue | 20 | 1.9% of revenue | 21.0 |
Net working capital | 110 | 113.6 | |
Increase (use of cash) | 3.6 |

The days come out of the Year 2 actuals, get rounded to 33, 75 and 44 as inputs, and the Year 3 balances are one formula each: days over 365 times revenue or cost of goods sold.
Notice how small the Year 3 build is compared with the $20 million build in Year 2. In Year 2, Ridgeline's DSO drifted up from 29 days to 33 and its DIO from 73 to 75, so most of that year's build came from slower collection and slower-moving inventory, not from growth. Hold the days flat and the build shrinks to the growth-only piece: about $3.6 million on $50 million of new revenue. Now let DSO slip to 40 days instead and receivables jump to 120.5, another $21 million of cash tied up. The days method shows you whether a working capital build comes from growth or from deteriorating terms, and the percent method hides the difference.
Where the inputs come from: receivables, inventory and payables from the balance sheet; revenue and COGS from the income statement; both over three historical years so you can see a trend rather than a point. The MD&A sometimes quotes DSO directly. In a modeling test case pack, the historicals are given and the prompt usually tells you to hold days flat; do that, and say so in a note, rather than inventing a trend you can't defend.
One mistake graders catch immediately: projecting every item as a percent of revenue when the business is changing shape. A hardware company shifting to subscriptions will see deferred revenue grow far faster than revenue for several years. A percent-of-revenue model misses the cash entirely.
11. The red flags: receivables growing faster than revenue, and four others
Interviewers who've sat through diligence have a short list of NWC warning signs. Learn these and you can answer "what would worry you about this company?" with something specific.
Receivables growing faster than revenue. Ridgeline grows revenue 10 percent, from $1.0 billion to $1.1 billion, while receivables grow 38 percent, from $80 million to $110 million. DSO moves from 29 days to about 37. One of three things is happening: the company loosened credit terms to hit a sales number, it shipped product into the channel that retailers didn't order (called channel stuffing), or its customers are having trouble paying. All three show up here before they show up in revenue. When receivables grow faster than revenue, the company is lending more to its customers to make its sales number, and the cash flow statement shows it before the income statement does. Check whether the allowance for doubtful accounts grew with the receivables. If it didn't, the earnings are softer than they look.
Inventory growing faster than cost of goods sold. DIO rising means product is piling up. Either demand slowed, the company overbuilt, or some of that inventory is obsolete and a write-down is coming. For retailers and electronics makers, this is the first number a short seller checks.
Payables days jumping without a stated change in terms. If DPO goes from 43 to 70 in a year and management hasn't announced a supplier program, the company is stretching its suppliers to flatter cash flow. It works once. The following year, suppliers want their money and the cash flow reverses.
Deferred revenue flat or falling while revenue grows. For a subscription business, deferred revenue is tomorrow's revenue already collected. If it stops growing, new bookings have stalled even though the income statement, which recognizes last year's bookings, still looks fine. It's a six-to-twelve-month leading indicator.
A sudden working capital release the year before a sale. Collections speed up, inventory drops, payables stretch, and free cash flow has its best year ever. Sellers do this before an auction. Buyers protect themselves with the peg in section 7.
12. The classic net working capital interview questions, answered in full
These come up in nearly every first round. Each answer below is the version I'd want a WSG student to give: the formula in one breath, then the mechanism.
"Walk me through what happens when inventory goes up by $10, paid in cash."
Income statement: nothing changes. Inventory is an asset until it's sold. Cost of goods sold only records it when a sale happens.
Cash flow statement: in the operating section, inventory is an operating asset, and an asset going up is a use of cash. Cash from operations falls by $10, and the net change in cash at the bottom is down $10.
Balance sheet: inventory is up $10, cash is down $10. Both are assets, so total assets are unchanged, liabilities and equity are unchanged, and the sheet balances.
The follow-up is usually "now it sells for $15, with a 25 percent tax rate." Income statement: revenue of 15, cost of goods sold of 10, pre-tax income of 5, taxes of 1.25, net income of 3.75. Cash flow statement: start with net income of 3.75, then add back 10 because inventory fell by 10 (an asset going down is a source of cash), so cash from operations is up 13.75. Balance sheet: cash is up 13.75 and inventory is down 10, so assets are up 3.75; retained earnings are up 3.75 from net income, so the sheet balances. Across both steps, cash is up a net 3.75, inventory is back where it started, and retained earnings are up 3.75. Buying inventory never touches the income statement, and selling it is the moment the cost and the profit both appear.
"A company starts paying its suppliers faster. What happens?"
Say Ridgeline cuts its payment terms and accounts payable falls from 70 to 55. The income statement doesn't change. The fabric was already an expense when the tents sold, and paying the bill sooner doesn't change what was spent. On the cash flow statement, payables are an operating liability, and a liability going down is a use of cash, so cash from operations falls by 15. On the balance sheet, cash is down 15 and payables are down 15; both sides fall together and it balances. Net working capital rose by 15 (a liability shrank), and that's your $15 million of cash gone.
Why would a company do it? Early-payment discounts. Standard terms like "2/10 net 30" (pay within 10 days and take 2 percent off, or pay the full amount at 30 days) sound small, but giving up 2 percent to hold cash for 20 extra days is like borrowing at about 37 percent a year (2 ÷ 98 × 365 ÷ 20). A company with cheap debt should pay early and take the discount. One with no cash shouldn't. Paying suppliers faster increases net working capital and uses cash, and the only reason to do it is a discount worth more than the cash.
"Why is deferred revenue a liability the company actually wants?"
Say a customer pays Ridgeline $120 upfront for a twelve-month gear subscription on January 1. At receipt: no revenue yet, so the income statement is untouched. Cash is up 120 and deferred revenue, a liability, is up 120. On the cash flow statement, deferred revenue is an operating liability and a liability going up is a source of cash: cash from operations is up 120.
End of January: Ridgeline has delivered one month, so it recognizes $10 of revenue. With no costs and a 25 percent tax rate, pre-tax income is 10, tax is 2.50, net income is 7.50. On the cash flow statement, start with net income of 7.50, then subtract 10 because deferred revenue fell by 10 (a liability going down is a use of cash). Cash from operations for the month is negative 2.50, which is exactly the tax paid. On the balance sheet, cash is down 2.50, deferred revenue is down 10, retained earnings are up 7.50; assets down 2.50, liabilities and equity down 2.50 (10 minus 7.50). It balances.
So why want it? Because the company got all $120 of cash on day one and spends the year delivering. It's an interest-free loan from the customer, and it's revenue the company already knows it will recognize. Deferred revenue is a liability that represents cash already received for work still to come, which is why software investors treat growth in it as good news. The risk, as section 9 covered, is that the loan shrinks the moment customers stop renewing.
"How does net working capital change in a recession?"
In two phases, and the second one surprises people.
Phase one, as the downturn hits: customers pay slower, so receivables rise. Sales slow faster than production, so inventory builds. Suppliers get nervous and tighten terms, so payables fall. For Ridgeline, say receivables go from 80 to 100, inventory from 120 to 150 and payables from 70 to 60. Net working capital goes from 90 to 150, a $60 million build, and that's $60 million of cash out the door at exactly the moment profits are falling. This is why healthy manufacturers can face a cash crunch in the first quarters of a recession.
Phase two, as the company adjusts: it cuts production, sells down the inventory it built, chases collections, and stops buying. Inventory and receivables fall. Net working capital unwinds, and cash from operations can actually improve while earnings are still shrinking. A positive-working-capital company bleeds cash into a recession and then releases cash as it shrinks, and a negative-working-capital company does the reverse. If the interviewer wants more, add the second half: an Amazon or a subscription business sees its customer and supplier float shrink as volume falls, so its cash flow weakens even if margins hold.
"What does a big build in net working capital tell you?"
That cash from operations came in well below net income, and you need to find out why. Compute the days. If DSO, DIO and DPO are stable and revenue grew, the build is the cost of growth and it's healthy. If revenue was flat and the days moved (collections slowed, inventory piled up, payables got paid faster), the quality of the earnings is weaker than the income statement shows. A working capital build driven by growth is an investment, and a build driven by slower collections or piled-up inventory is a warning, and the days ratios tell you which one you're looking at. In a diligence setting, you'd also check whether the build is seasonal (a toy maker in October) before drawing a conclusion.
"Does an increase in net working capital affect EBITDA?"
No. EBITDA is built from the income statement, which records revenue when earned and costs when incurred regardless of cash timing. Receivables, inventory and payables moving around don't touch it. That's the whole reason free cash flow subtracts the change in NWC: EBITDA tells you what the business earned, and the NWC line tells you how much of it hasn't turned into cash yet. EBITDA ignores working capital entirely, so a company can post record EBITDA while cash from operations falls, and the gap between the two is the working capital build. If an interviewer pushes with "then why do lenders set covenants on EBITDA?", the answer is that it's a cleaner measure of earning power across years, and lenders watch the cash flow statement separately.
Say this, don't say that
What is net working capital?
Don't say: "Current assets minus current liabilities."
Say: "In a model, operating current assets minus operating current liabilities: receivables, inventory and prepaids less payables, accrued expenses and deferred revenue. Cash and debt stay out because they're financing, not operations."
Why does an increase in net working capital reduce cash flow?
Don't say: "Because it's subtracted on the cash flow statement."
Say: "Because the income statement counted sales the company hasn't collected yet and ignored inventory it already paid for. The change in NWC adjusts net income back to the cash that actually moved."
Is negative working capital a bad sign?
Don't say: "Yes, it means the company can't cover its short-term liabilities."
Say: "It depends on the cause. Amazon's is negative because customers pay before suppliers get paid, and that funds growth. A struggling retailer's is negative because it can't pay suppliers. I'd check the trend in payables days against the cash balance."
Where does net working capital show up in a DCF?
Don't say: "You subtract net working capital from free cash flow."
Say: "You subtract the increase in net working capital each projected year. The balance itself never enters the DCF, only the year-over-year change."
What is a working capital peg?
Don't say: "It's the working capital included in the deal."
Say: "It's the normal level of net working capital the buyer and seller agree the business needs, usually a trailing twelve-month average. If closing NWC lands below the peg, the price drops dollar for dollar. Above it, the price rises."
What would worry you about a company's working capital?
Don't say: "If it's too high."
Say: "Receivables growing faster than revenue. It usually means looser credit terms or customers in trouble, and I'd check whether the bad debt allowance kept pace."
Build the table once and the questions stop being hard
A student came to WSG the week after that first round. We spent one session building a version of the Ridgeline table from scratch and then breaking it: change receivables, trace it through all three statements, change payables, trace it again. In his next first round, at a different middle market bank, the interviewer asked what happens when a company collects its receivables faster. He walked it in four sentences and got a follow-up about the cash conversion cycle, which he also walked. He had a Summer Analyst offer from that bank before spring break.
The formula takes ten seconds to learn, and the mechanism takes an afternoon. It's the same afternoon that makes the DCF, the LBO and half the sophomore interview guide make sense. Open a blank spreadsheet, type in Ridgeline's six operating lines, and change one number at a time until the signs are obvious. That's the version of net working capital interviewers are listening for.


Comments